

Intracellular Iron Measurement
Iron is the most abundant transition metal element within organisms, and it participates in various physiological activities. Recently, free iron in living cells has attracted attention because its high reactivity may be related to cellular damage or death. Free iron exists in its stable redox states, namely ferrous ion (Fe2+) and ferric ion (Fe3+). In living cells, understanding the behavior of Fe2+ is considered more important than understanding that of Fe3+ because of the intracellular reductive environment, metal transporters, and the water solubility of Fe2+. FerroOrange has no chelating ability. FerroOrange and Fe2+ react irreversibly, which is different from the detection principle of calcium-ion probes such as Fluo 3.
In 2012, Ferroptosis was proposed as one of new cell deaths. Ferroptosis is studied as non apoptotic cell death caused by accumulation of iron ion-dependent lipid peroxide. FerroOrange is a novel fluorescent probe that enables live-cell fluorescent imaging of intracellular Fe2+, used in ferroptosis research.
Technical info
Experimental Example
HeLa cells treated with chelator of iron 2,2′-bipyridyl (Bpy) (100 μmol/L) or Ammonium iron (II) sulfate (100 μmol/L) were prepared. The change of intracellular Fe2+in HeLa cells was detected by the FerroOrange.
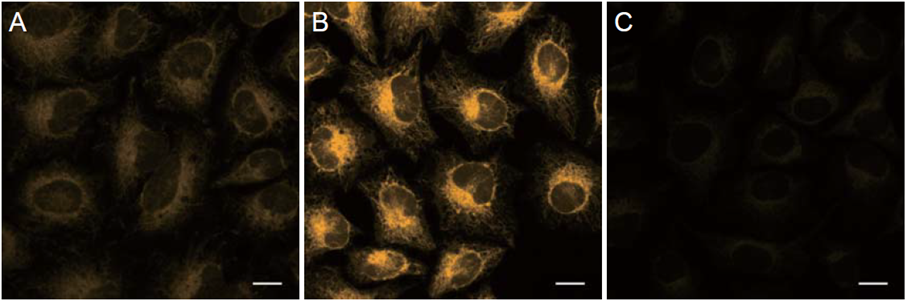
Ex/Em = 561 nm/570-620 nm, Scale bars 20 μm
A: Control
B: Ammonium iron (II) sulfate treated
C: Ammonium iron (II) sulfate and 2,2′-Bipyridyl (Bpy) treated
The fluorescence intensity of FerroOrange was increased in HeLa cells treated with Ammonium iron (II) sulfate compared with the findings in untreated cells; conversely, its fluorescence intensity was decreased in cells treated with Bpy.
Easy quantification by plate assay
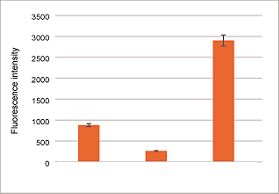
Ex/Em = 543 nm/ 580 nm
Left Control
Middle Ammonium iron (II) sulfate and 2,2′-Bipyridyl (Bpy) treated
Right Ammonium iron (II) sulfate treated
The change of intracellular Fe2+in HeLa cells was quantified by the FerroOrange.
High selectivity for Fe2+
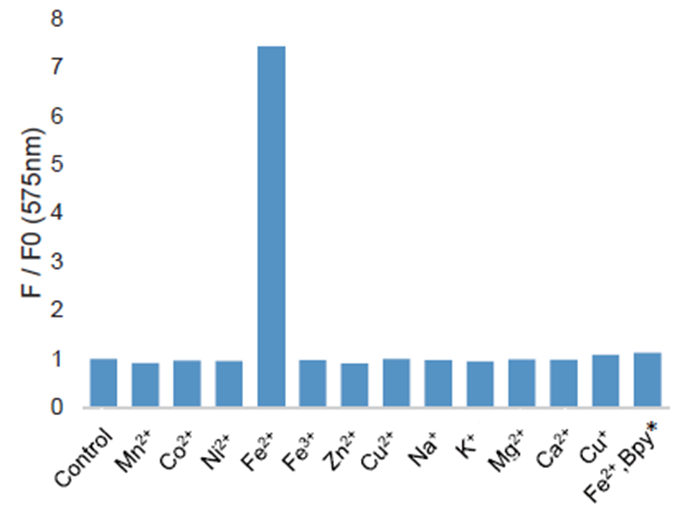
Ex/Em = 543 nm/ 580 nm
2 μL of 1 mmol/L FerroOrange and 2 μL of 10 mmol/L from each metal were added to 1 mL of 50 mmol/L HEPES Buffer (pH7.4). The fluorescence intensity was measured after the reaction, for 1hr, at room temperature.
Applications
<High-throughput methods for monitoring subcellular labile Fe2+>
FerroOrange is ready to use for a 96-well-plate-based high-content imaging of labile Fe(II) in living cells. In the following article, Dr. Hirayama etc. were able to conduct high-throughput screening of a chemical library containing 3399 compounds.
*FerroOrange is mentioned as “RhoNox-4” in the reference.
*FerroOrange was commercialized under the advisory of Dr. Hideko Nagasawa and Dr. Tasuku Hirayama (Gifu Pharmaceutical University).
<Ferrous ion(Fe2+) detection in mouse liver in ferroptosis research>
In the following article, ferrous ions (Fe2+) were detected in mouse livers using FerroOrange (Ferroptosis research).
*mice were fed on methionine- choline deficient diet
For details about the experiment, please visit the reference below.
Co-staining with Each Organelle Dye Reagent
FerroOrange was co-stained with each organelle’s dye reagents.
HeLa cells were stained with organelle’s dye and washed.
Then, FerroOrange was added to the cells and cells were observed under the fluorescent microscope.
Co-staining with ER Staining Dye
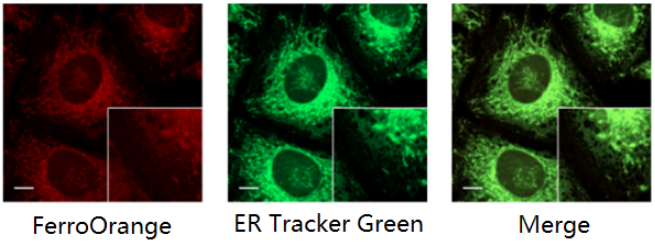
FerroOrange: Ex. 561 nm, Em. 570-620 nm
ER Tracker Green (ER Dye): Ex. 488 nm, Em. 510-555 nm
Scale bars: 10 µm
Co-staining with Mitochondrial staining Dye
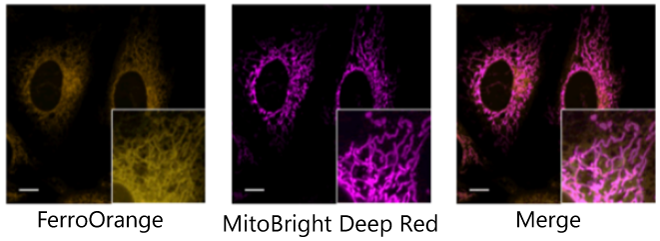
FerroOrange: Ex. 561 nm, Em. 570-620 nm
MitoBright Deep Red (Mitochondrial Dye): Ex. 640 nm, Em. 650-700 nm
Scale bars: 10 µm
Co-staining with Golgi Complex Staining Dye
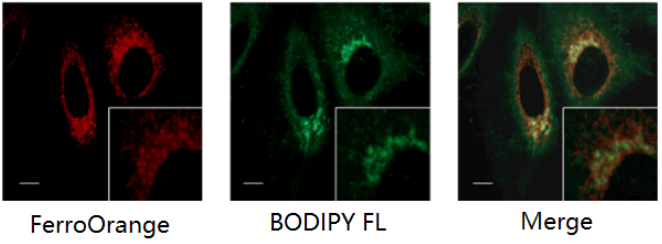
FerroOrange: Ex. 561 nm, Em. 570-620 nm
BODIPY FL (Golgi Complex Staining Dye): Ex. 488 nm, Em. 510-555 nm
Scale bars: 10 µm
Fruorescence property
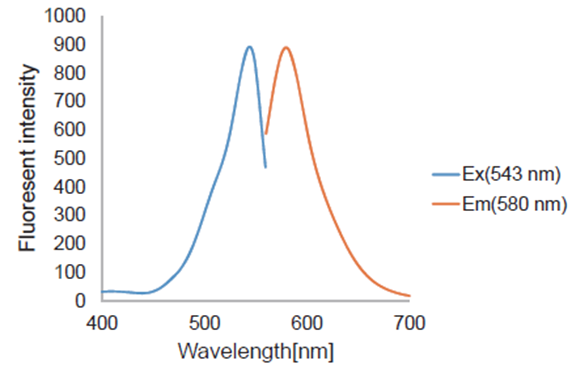
Quantitative Analysis by Flow Cytometer
・FerroOrange may affect staining intensity, depending on cell density and cell type.
*Please refer to Q&A “Is it necessary to wash cells after staining?”.
・Furthermore, a dye may leak out of the cells, depending on a medium change and a wash.
・For these reasons, you need to optimize when performing quantitative flow cytometry.
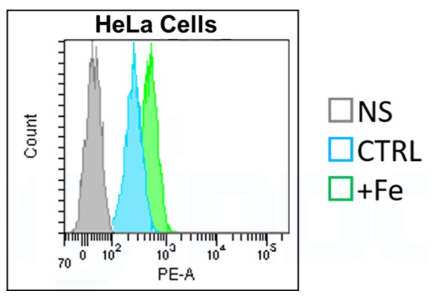
1. HeLa cells (1 x10⁵ cells/well) in MEM (10% fetal bovine serum, 1% penicillin-streptomycin) were seeded on a 6 well plate and were cultured at 37oC in a 5% CO2 incubator overnight.
2. The cells were washed with serum-free medium (2 mL) three times. Then, serum-free medium (1 mL) was added to the cells.
3. 10 mmol/L Ammonium iron (II) sulfate (10 μL) was added to wells (The final concentration: 100 μmol/L).
4. To mix Ammonium iron(II) sulfate and serum-free medium, the entire medium was pipetted up from wells and then immediately pipetted back one time.
5. The cells were incubated for 20 min in a 37oC incubator equilibrated with 95% air and 5% CO2, and the cells were washed with HBSS (1 mL) three times.
6. After trypsinization (250 µL), stop the reaction with serum medium (1 mL), 1.25 ml of the cell suspension was transferred to a microcentrifuge tube.
7. The cells suspension was centrifuged at 1,500 rpm for 3 minutes.
8. The supernatant was discarded and HBSS (1 mL) was added to the microcentrifuge tube and suspended by pipetting.
9. The cells suspension was centrifuged at 1,500 rpm for 3 minutes and the supernatant was discarded.
10. 1 μmol/L FerroOrange in MEM (serum-free medium) (300 μL) was added to the cells.
11. The cells were incubated for 15 -30 min in a 37oC incubator equilibrated with 95% air and 5% CO2.
12. The stained cells were passed through a cell strainer and analyze samples using a flow cytometer.
1. FerroOrange leaks into the extracellular space due to washing cells after staining; therefore, we suggest you measure cells immediately after staining (Non wash).
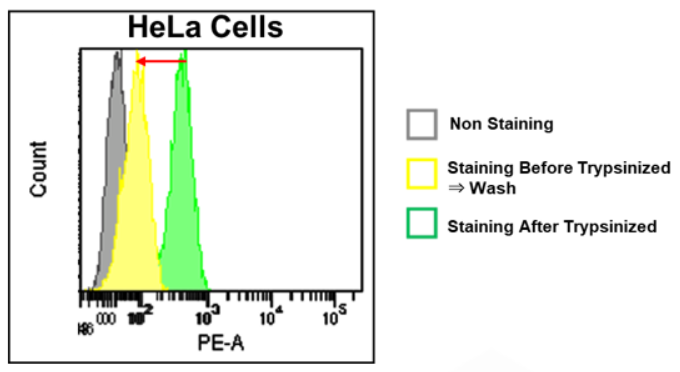
2. We recommend you add equal volumes of dye solutions, because fluorescence intensity can sometimes vary in a dye solution volume-dependent manner.
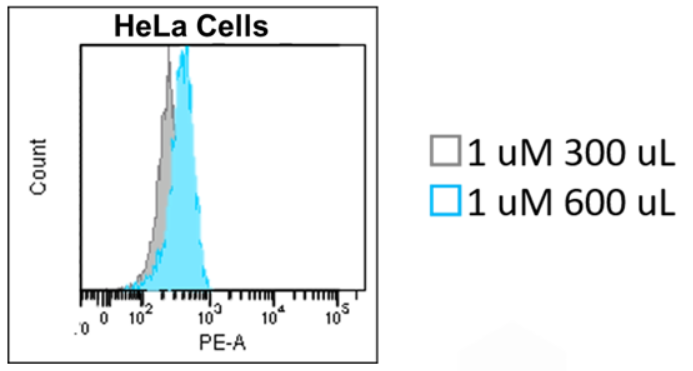
3. To verify experimental conditions for detecting Fe(II), we recommend you prepare a sample containing ammonium iron (II) sulfate and then observe changes in the fluorescence intensity of FerroOrange.
Induction of Ferroptosis by Erastin
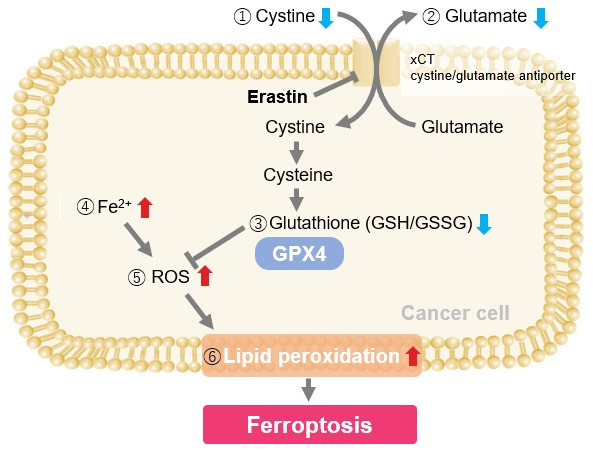
Erastin is a known inducer of ferroptosis. By inhibiting the cystine transporter (xCT), erastin inhibits the uptake of cystine. Cystine is the raw material for GSH. Therefore, Erastin ultimately decreases the amount of GSH. Decreased GSH then results in lipid peroxide accumulation and induction of ferroptosis.
The following experimental examples show changes in each aforementioned index as a consequence of erastin stimulation. Measurements are made using Dojindo reagents.
Using erastin-treated A549 cells, we measured intracellular Fe2+, ROS, lipid peroxide, glutathione, glutamate release into the extracellular space, and cystine uptake. As a result, inhibition of xCT by elastin was observed and also the release of glutamate and uptake of cystine were decreased. Furthermore, elastin treatment decreased intracellular glutathione while it increased intracellular Fe2+ , ROS, and lipid peroxides.

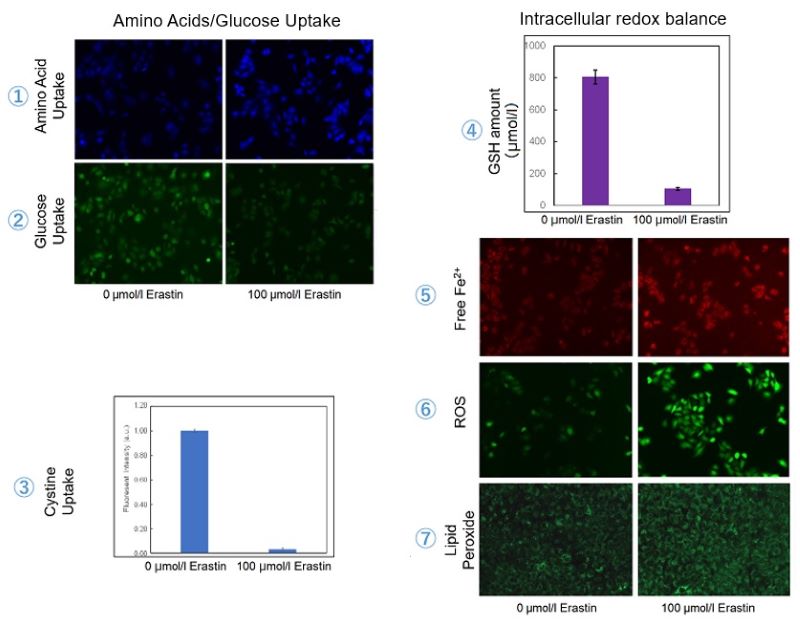
| 1 Amino Acid Uptake | : Amino Acid Uptake Assay Kit (Code: UP04) |
| 2 Glucose Uptake | : Glucose Uptake Assay Kit-Green (Code: UP02) |
| 3 Cystine Uptake | : Cystine Uptake Assay Kit (Code: UP05) |
| 4 Intracellular glutathione | : GSSG/GSH Quantification Kit (Code: G257) |
| 5 Intracellular labile Fe | : FerroOrange (Code: F374) |
| 6 Intracellular total ROS | : ROS Assay Kit -Highly Sensitive DCFH-DA- (Code: R252) |
| 7 Lipid Peroxides | : Liperfluo (Code: L248) |
Cell Line: A549
Incubation Conditions: 100 μmol/l Erastin/MEM, 37℃, 3h