

The lysosome is an organelle in which a biomembrane forms an acid vacuole. Lysosomes contain various degrading enzymes and contribute to maintaining intracellular homeostasis by acting as a waste disposal system. Recent findings reveal that lysosomal dysfunction is related to some neurodegenerative disorders. Consequently, the investigation of lysosomal function is attracting considerable interest in the scientific community.
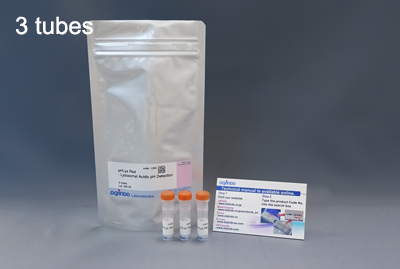
Live imaging using small molecule fluorescent probes has been widely used for lysosomal live cell analysis, but the low specificity and retention ability due to pH change have been cited as issues. The pHLys Red is a small molecule fluorescent probe with high lysosomal specificity and sensitivity to pH changes, enabling a more accurate analysis of lysosomal pH in live cells. It is also applicable to experiments that require long-term imaging due to its high retention ability.
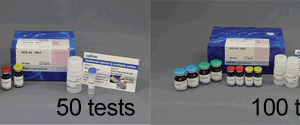
Lysosomal Analysis Products
| Product Name | Lysosomal pH Detection Dyes and Fluorescence Properties |
Lysosomal Quantity Detection Dyes and Fluorescence Properties |
|---|---|---|
| Lysosomal Acidic pH Detection Kit | pHLys Red Ex: 561 nm / Em: 560-650 nm |
LysoPrime Green Ex: 488 nm / Em: 500-600 nm |
| Lysosomal Acidic pH Detection Kit – Green/Deep Red | pHLys Green Ex: 488 nm / Em: 490-550 nm |
LysoPrime Deep Red Ex: 633 nm / Em: 640-700 nm |
| pHLys Red – Lysosomal Acidic pH Detection | pHLys Red Ex: 561 nm / Em: 560-650 nm |
|
| LysoPrime Deep Red – High Specificity and pH Resistance | LysoPrime Deep Red Ex: 633 nm / Em: 640-700 nm |
|
| LysoPrime Green- High Specificity and pH Resistance | LysoPrime Green Ex: 488 nm / Em: 500-600 nm |

Technical info
Comparative Performance Analysis
All data were generated in-house under identical imaging and treatment conditions.
Lysosomal pH Sensors
| Dye | pHLys Green | pHLys Red | Lysosomal pH Sensor Green Major commercial supplier |
|
pH Sensitivity |
High pH Responsiveness Signal clearly reduced under Baf. treatment 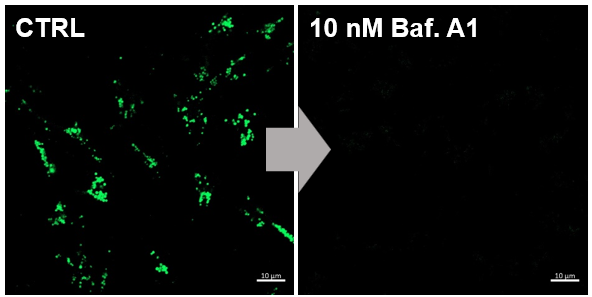 |
High pH Responsiveness Signal clearly reduced under Baf. treatment
|
Less sensitive Incomplete signal suppression under Baf. treatment 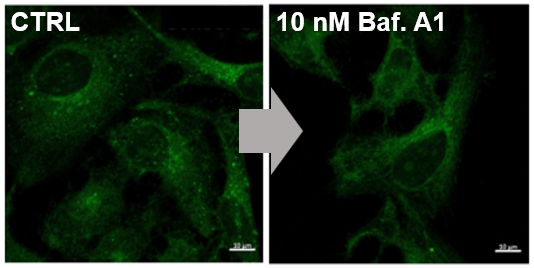 |
|
Lysosomal Retention Time |
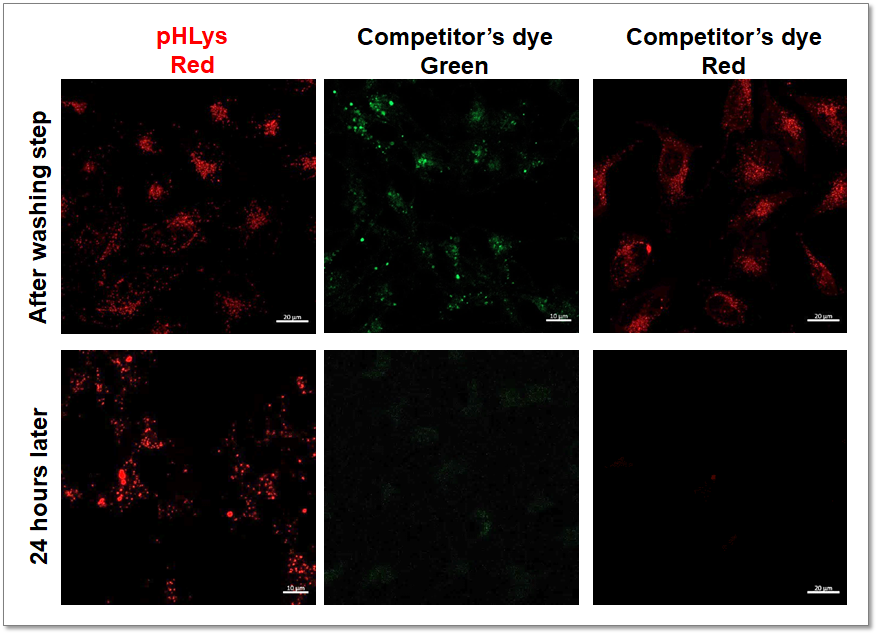
Long-term Retention Stable Localization (>24 h) 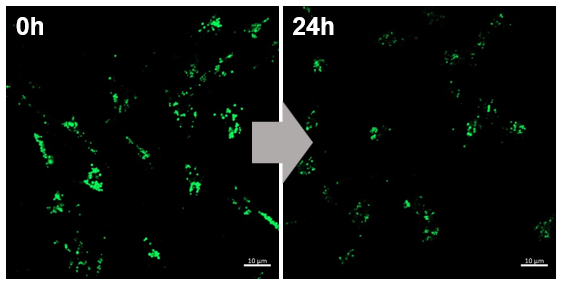 |
Long-term Retention Stable Localization (>24 h) 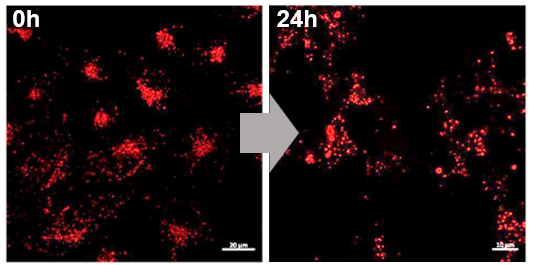 |
Rapid signal decrease <90 min (identical conditions) 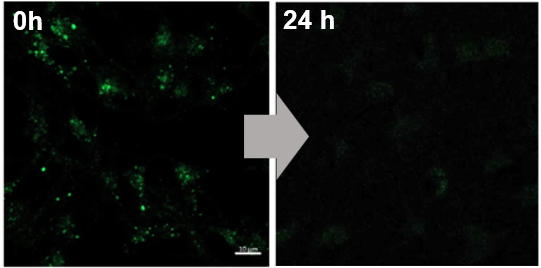
|
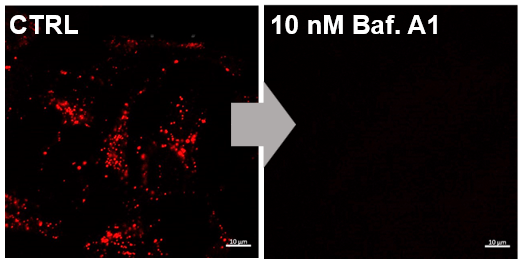
Sharp Sensitivity for Lysosomal pH Detection
Competitor’s dye for lysosomal pH detection has issues in accurate lysosomal localization and sensitivity. Fluorescence imaging of HeLa cells treated with low concentrations of the lysosomal acidity inhibitor Bafilomycin A1 (Baf. A1) and stained with pHLys Red or competitor’s dye was compared. The results showed that pHLys Red was more sensitive to changes in lysosomal pH than the competitor’s dye, indicating that pHLys Red is more sensitive to changes in lysosomal pH than the competitor’s dye.
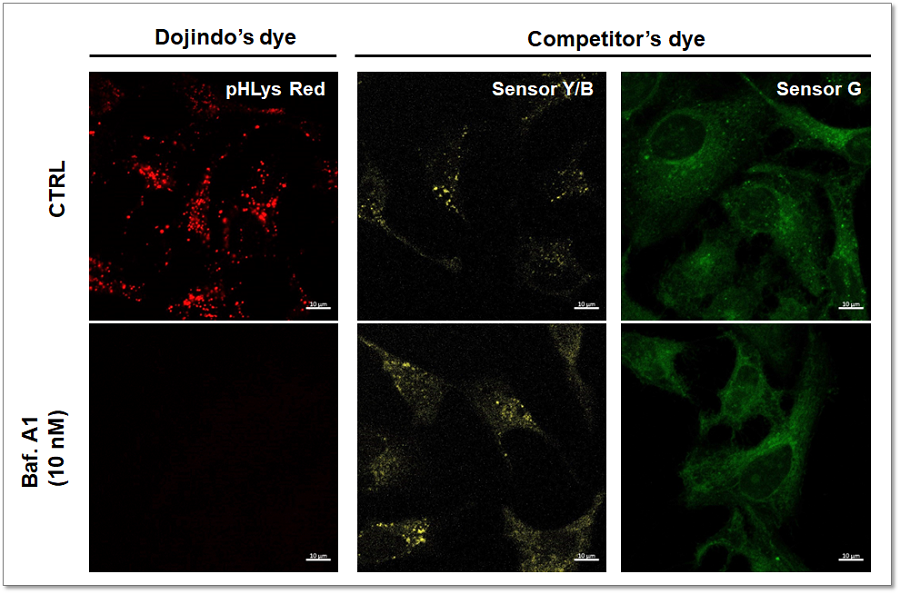
<Experimental Conditions>
pHLys Red:Ex = 561 nm, Em = 560 – 620 nm
Sensor Y/B:Ex = 561 nm, Em = 560 – 620 nm
Sensor G:Ex = 488 nm, Em = 490 – 550 nm
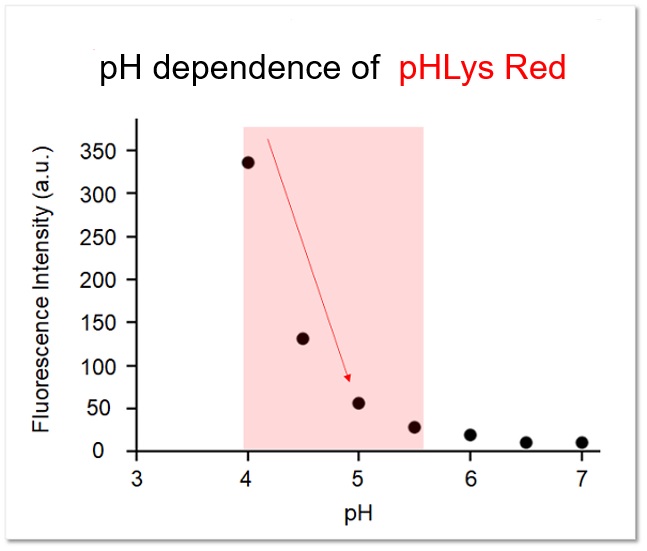
The fluorescence intensity of pHLys Red at each pH was confirmed in vitro, and it was confirmed that the fluorescence intensity changed sensitively within the range of lysosomal pH (pH 4.0-5.5).
High Specificity for Lysosomes
The lysosomal localization of competitor’s dye and pHLys Red was compared using HeLa cells expressing the lysosomal marker protein LAMP1-GFP. The competitor’s dye stained HeLa cells showed higher background due to the leakage from lysosomes, whereas pHLys Red showed lower background (Merged image). The pHLys Red was found to be more accurately localized to lysosomes compared to the competitor’s dye.
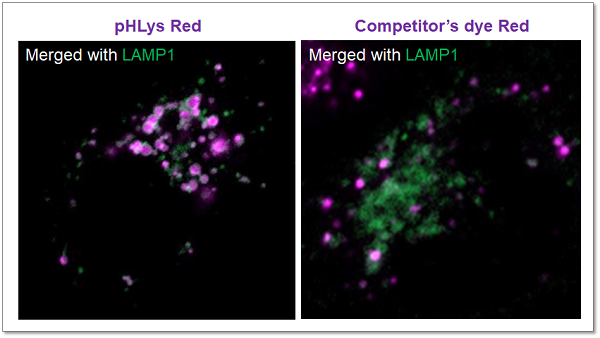
<Experimental Conditions>
Green: Ex= 488 nm, Em= 500-570 nm
Red : Ex= 561 nm, Em= 560-620 nm
High Retention in Lysosome
The lysosomal retention ability of pHLys Red and competitor’s dye was compared using cells stained with each dye. The fluorescence of the competitor’s dye decreased 24 hours after staining, whereas the fluorescence of pHLys Red was maintained and retention was high.
<Experimental Conditions>
Green: Ex= 488 nm, Em= 490-550 nm
Red: Ex= 561 nm, Em= 560-620 nm
Application Data: Lysosomal Mass and pH Exchange in Senescence-induced Cells
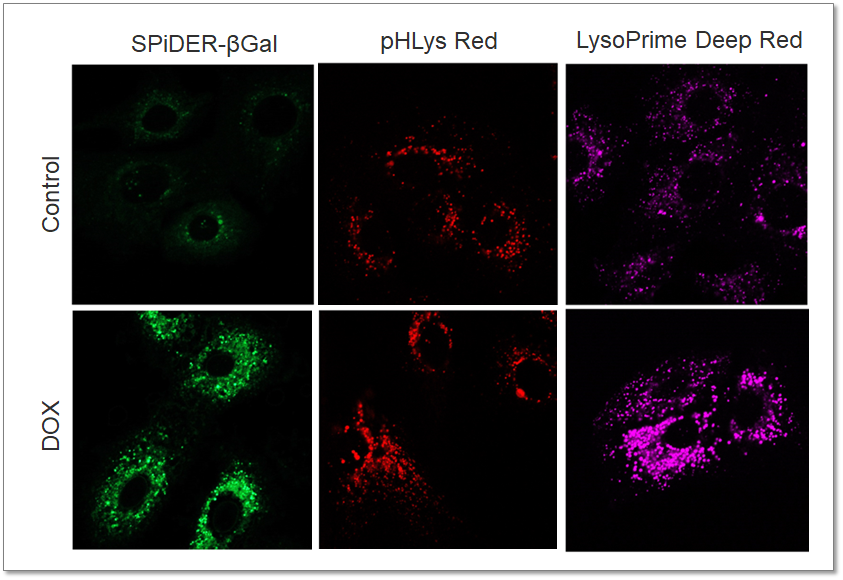
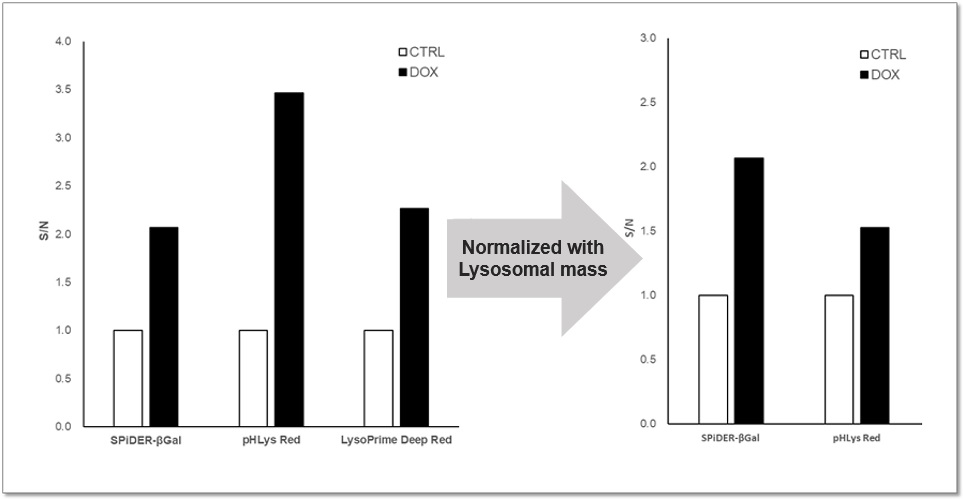
We analyzed senescence-associated acidic β-galactosidase (SA-βGal) activity and lysosomal mass and pH in A549 cells treated with Doxorubicin (DOX) to induce senescence. The SA-βGal activity was detected by SG03 Cellular Senescence Detection Kit – SPiDER-βGal, the lysosomal mass and pH were detected separately with L264 LysoPrime Deep Red and pHLys Red. Fluorescence imaging showed that the increase in lysosomal mass and pH acidification were observed in senescence-induced cells, and the normalized fluorescence intensity of lysosomal mass and pH by plate reader measurement showed the same result.

<Experimental Conditions>
SA-βGal(Green):
Ex = 488 nm, Em = 490 – 550 nm
Lysosomal pH (Red):
Ex = 561 nm, Em = 560 – 620 nm
Lysosomal mass (Deep Red):
Ex = 633 nm, Em = 640 – 700 nm
<Experimental Conditions>
SA-βGal: Ex = 525 – 535 nm, Em = 550 – 570 nm
Lysosomal pH: Ex = 555 – 565 nm, Em = 590 – 610 nm
Lysosomal mass: Ex = 645 – 655 nm, Em = 690 – 710 nm