


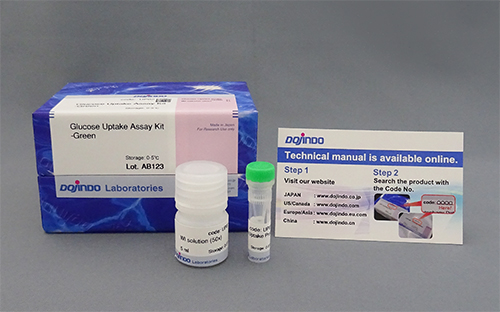
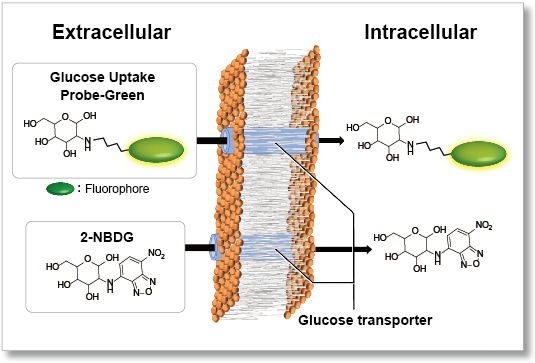
Nutrient metabolism is necessary for energy production in cells and regulates various cellular functions, including gene expression. Glucose is one of the key substrates for the generation of ATP and to sustain cellular homeostasis. Thus, glucose metabolism has been the subject of intense investigations. In cancer research, tumor cells enhance glucose uptake and consumption for their growth and proliferation. Therefore, elevated glucose uptake is a marker of tumors, and glucose transporters are important targets in cancer treatment. One common method for evaluating the glucose uptake ability of cells uses radioisotope-labeled glucose. Although this method has been used for many years, it requires special handling facilities and disposal of radioactive materials. The enzyme cycling method using 2-deoxy-D-glucose, which enables colorimetric and fluorometric plate assays, cannot be applied to cell imaging and flow cytometry. Recently, 2-NBDG, a fluorescently labeled glucose analog, has been used widely to detect cellular glucose uptake by fluorescence imaging and flow cytometry. However, the sensitivity of this method is poor because of the low fluorescence intensity of 2-NBDG. To resolve these limitations, a novel fluorescent probe, Glucose Uptake Probe-Green, was developed. This probe emits strong green fluorescence (λex = 507 nm, λem = 518 nm), allowing highly sensitive detection of cellular glucose uptake by fluorescence imaging, flow cytometry or microplate assay. The WI Solution in this kit enhances cellular retention of the probe to give more reliable data.
Glucose Uptake Assay Products
| Products | Plate Reader | Microscope / FCM |
|---|---|---|
| Glucose Uptake Assay Kit-Blue | ✗ | ✓ |
| Glucose Uptake Assay Kit-Green | ✓ | ✓ |
| Glucose Uptake Plate Assay Kit (Green) | ✓ Best* | ✗ |
| Glucose Uptake Assay Kit-Red | ✓ | ✓ |
*No washing step, minimizing cell stress and detachment while improving reproducibility.
Technical info
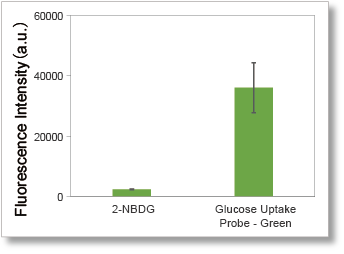
The use of a high-fluorescence intensity dye enables higher sensitivity measurements in a shorter time than the conventional method (2-NBDG).
1. High-sensitivity determination
Uses a fluorescent dye with superior brightness, which is different from the fluorescence intensity of 2-NBDG, which decreases in water.
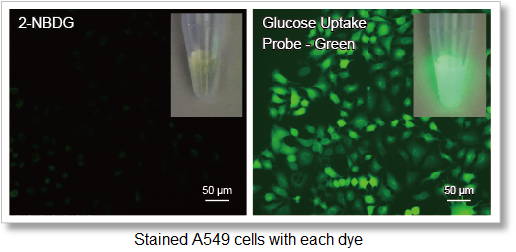
Deteciton conditions
Cells: A549 cells
Detection system: Fluorescence microscope
Filter set: GFP (Ex: 470/40 nm, Em: 525/50 nm)
2. Quick process
Significantly reduced measurement time despite using the same process as 2-NBDG.

The operation is very simple, requiring only three steps: pretreatment, staining (incorporation), and washing.
.png)
3. Plate reader compatibility
Supports plate reader measurements that are difficult to perform with 2-NBDG.
Deteciton conditions
Cells: A549 cells
Ex: 488 nm, Em: 520 nm
4. Reduces dye leakage after staining
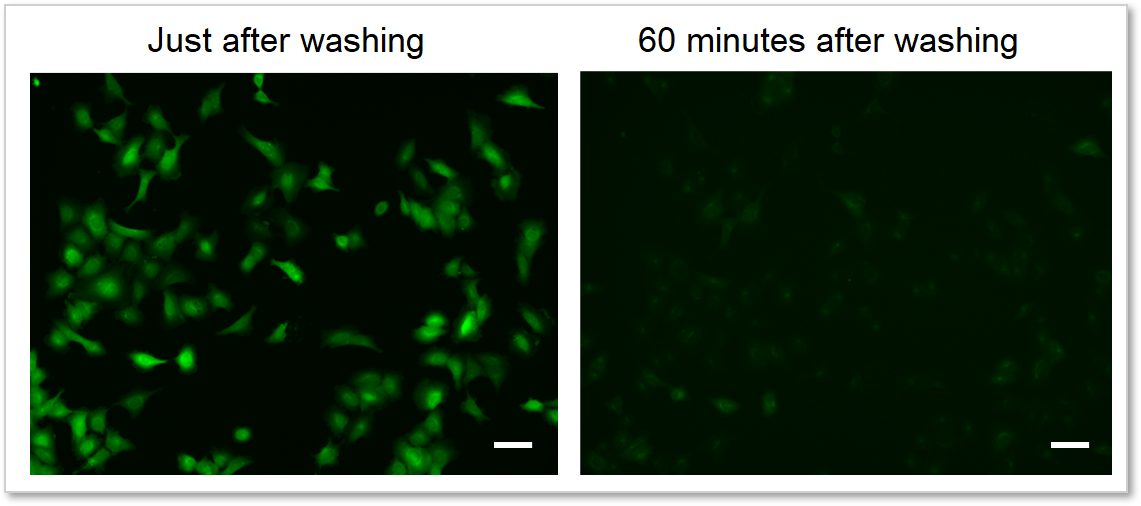
The included WI Solution suppresses reagent leakage and ensures stable data acquisition.
When cells are washed with HBSS
When cells are washed with WI Solution
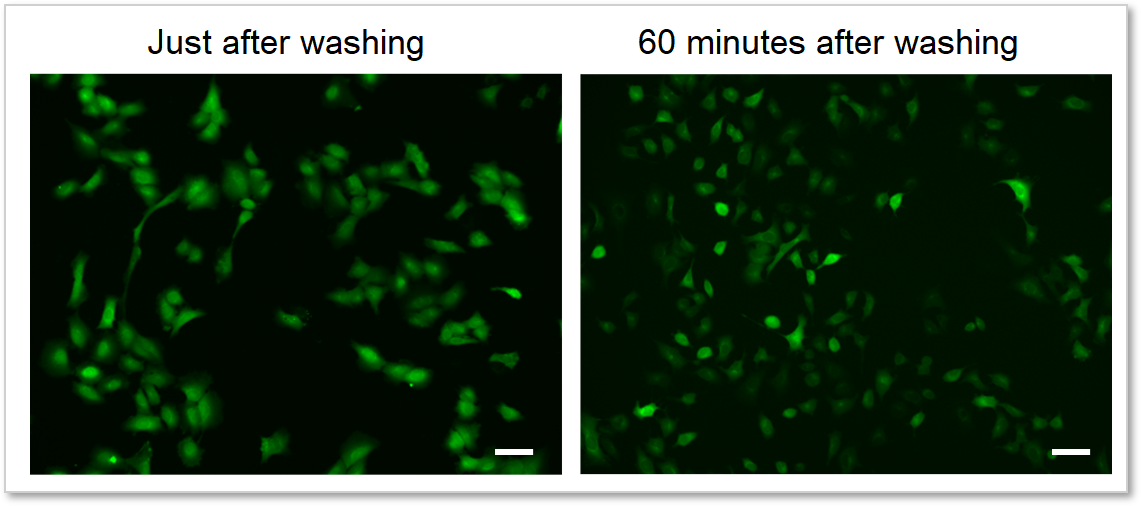
Deteciton conditions
Cells: A549 cells
Detection system: Fluorescence microscope
Filter set: GFP (Ex: 470/40 nm, Em: 525/50 nm)
Comparison with existing method
The comparison of the Glucose Uptake Probe Series and the existing method(2-NBDG) is as below.
| product name | Fluorescence microscope | Plate reader detection | FCM detection | Retention ability | Fluorescence characteristics |
|---|---|---|---|---|---|
| Glucose Uptake Assay Kit-Blue | ✓ | – | ✓ | 1 hour * | λex:386 nm λem:474 nm |
| Glucose Uptake Assay Kit-Green | ✓ | ✓ | ✓ | 1 hour * | λex:507 nm λem:518 nm |
| Glucose Uptake Assay Kit-Red | ✓ | ✓ | ✓ | 1 hour * | λex:560 nm λem:572 nm |
| 2-NBDG | ✓ | – | ✓ | 30 minutes or less * | λex:465 nm λem:540 nm |
*Result of A549 cells, the retention time for other cell lines may be different.
Difference from Glucose Assay Kit
Difference between Glucose Uptake Assay Kit-Green and Glucose Assay Kit-WST (product code: G264)
1. Glucose Uptake Assay Kit-WST can quantify glucose consumption in cell supernatant. On the other hand, Glucose Uptake Assay Kit-Green cannot quantify glucose.
2. Glucose Uptake Assay Kit-Green can measure the difference of glucose uptake capacity in a short time, while Glucose Assay Kit-WST cannot measure the change of glucose level in a short time.
The difference between the Glucose Assay Kit-WST and this kit will be explained using the following experimental example.
The difference between the Glucose Assay Kit-WST and this kit will be explained using the following experimental example.
Example of experiment: Measurement of glucose consumption and uptake capacity of HepG2 treated with glucose uptake inhibitor (Cytochalasin B).
Flowchart of the experiment and experimental results
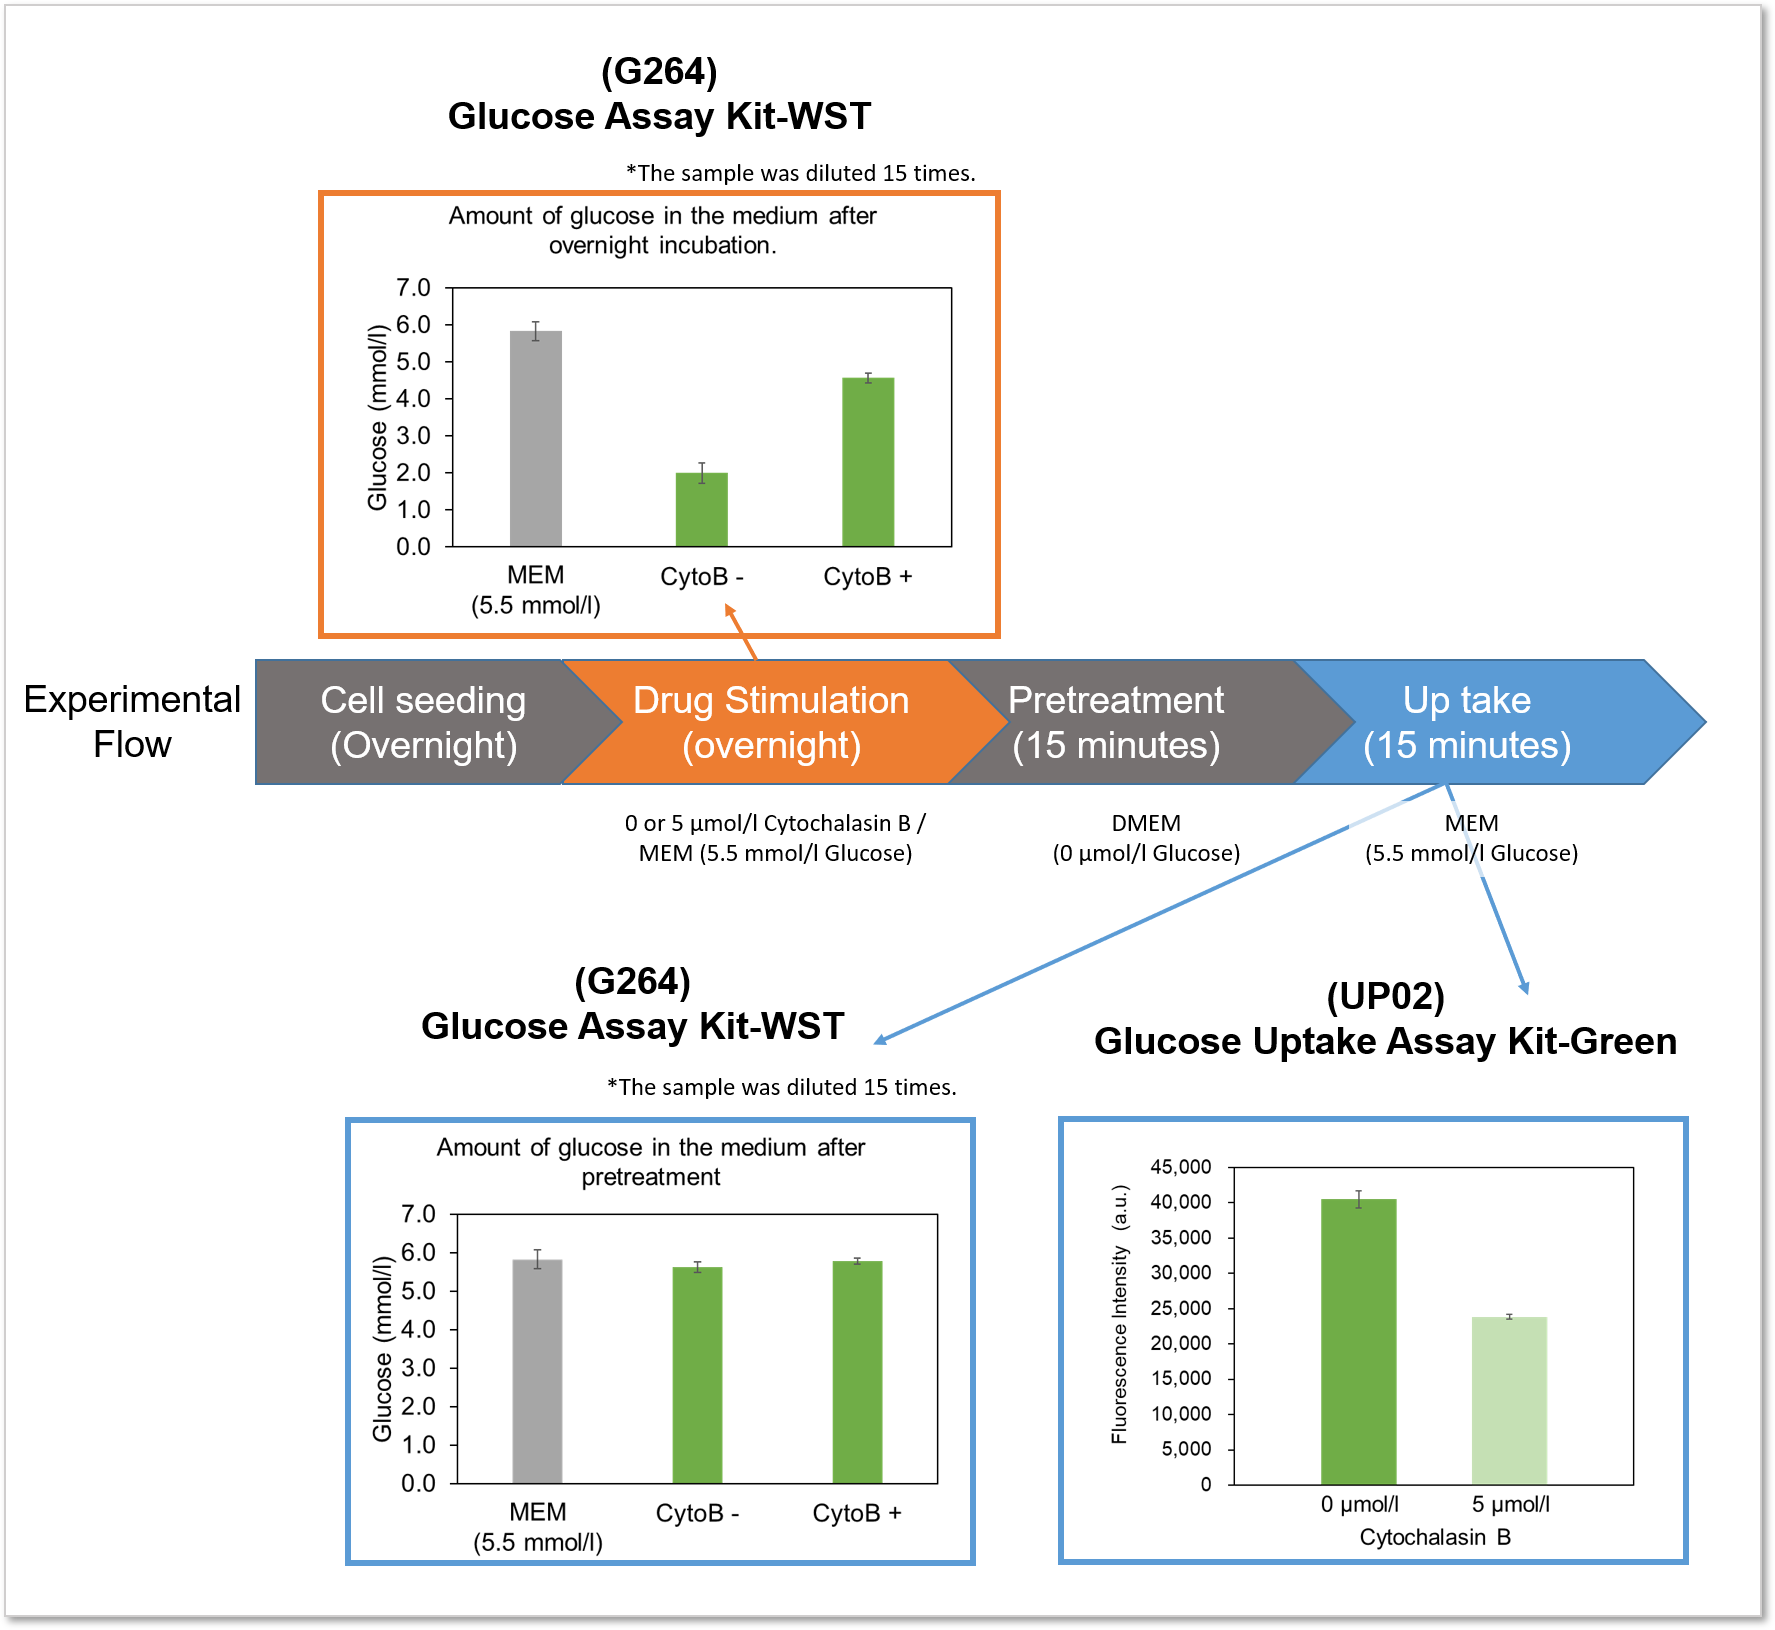
Experimental example: Inhibition of glucose uptake by Cytochalasin B
Using this kit, we were able to detect the inhibition of glucose uptake by the glucose transporter inhibitor Cytochalasin B in HepG2 cells with high sensitivity.
Fluorescence microscope observation
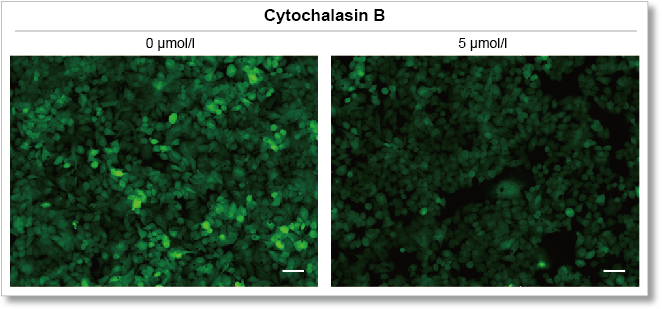
(scale bar: 50 μm)
Measurement conditions
Cells: HepG2
Medium: MEM (5.5 mmol/l Glucose)
Culture conditions: 5 µmol/l Cytochalasin B/MEM (5.5 mmol/l Glucose, 10% FBS), 37 °C, 24 h
Staining conditions: Glucose Uptake Probe/DMEM (0 mol/l Glucose) diluted by 500-fold, 37 °C, 15 min
Detection system: Fluorescence microscope
Filter set: GFP (Ex: 470/40 nm, Em: 525/50 nm)
Plate reader detection
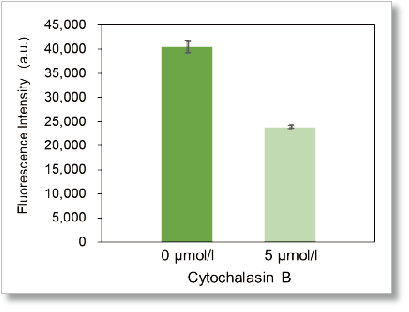
Ex: 488 nm, Em: 520 nm
Experimental example: Enhanced glucose uptake by insulin
Using this kit, we were able to measure enhanced insulin-induced glucose uptake in adipocytes with high sensitivity.
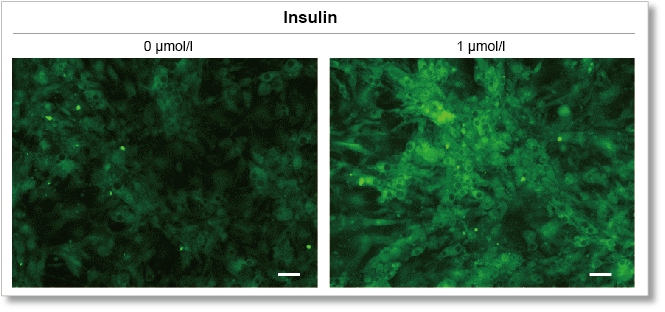
(scale bar: 50 µm)
Measurement conditions
Cells: mouse adipocytes
Medium: DMEM (5.5 mmol/l Glucose)
Culture conditions: 1 µmol/l Insulin/DMEM (5.5 mmol/l Glucose), 37 °C, 15 min
Staining conditions: ×500 Glucose Uptake Probe/DMEM (0 mol/l Glucose), 37 °C, 15 min
Detection system: Fluorescence microscope
Filter set: GFP (Ex: 470/40 nm, Em: 525/50 nm)
Scale bar: 50 μm
Plate reader detection
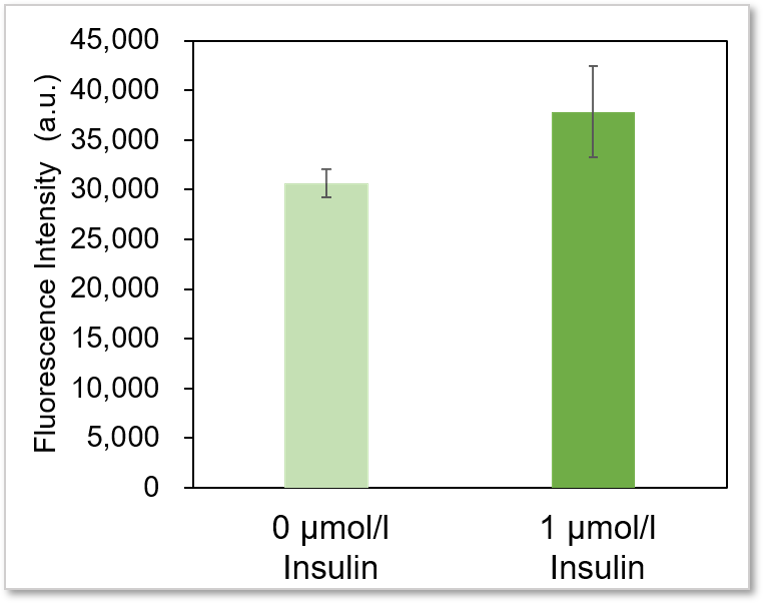
Detection conditions
Ex: 488 nm, Em: 520 nm
* It is difficult to make adipocyte evenly on the wells, so there may be some error in the data.
Experimental procedure
1. Adipocytes were seeded onto ibi 96-well plates and cultured overnight.
2. The cells were washed twice with glucose-free medium DMEM, and then glucose-free medium was added.
3. The cells were incubated at 37 °C for 15 minutes.
4. Probe solution (500-fold dilution) in glucose-free medium was added, and the cells were incubated at 37 °C for 15 minutes.
5. Wash the cells three times with WI Solution (1x) chilled to 4 °C and add WI Solution (4 °C).
6. The cells were observed using a fluorescence microscope and plate reader.
Experimental example: Comparing the glucose uptake capacity of progenitor adipocytes and adipocytes
Using this kit, we were able to detect and quantify the difference in glucose uptake capacity between progenitor adipocytes and adipocytes with high sensitivity.
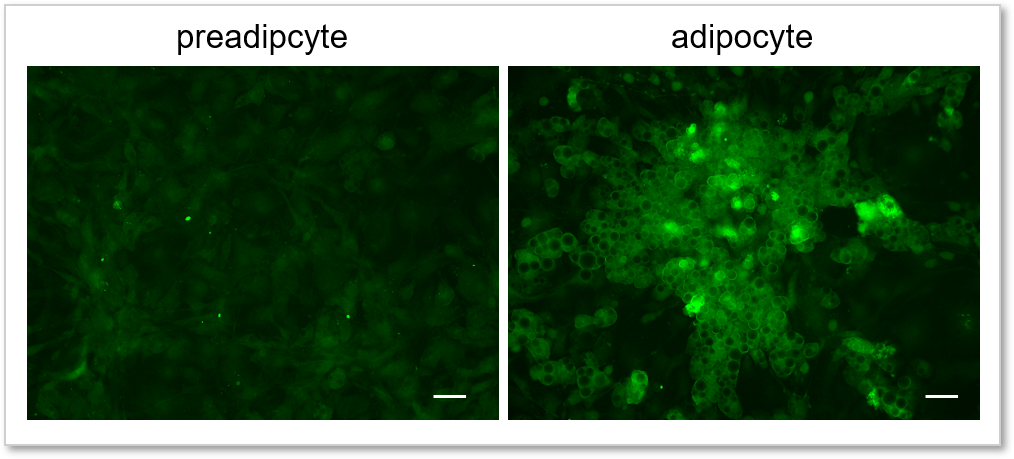
(scale bar: 50 µm)
Measurement conditions
Cells: preadipocyte, adipocyte
Medium: DMEM (5.5 mmol/l Glucose, 10% FBS)
Staining conditions: Glucose Uptake Probe/DMEM (0 mol/l Glucose) diluted by 500-fold, 37 °C, 15 min
Detection system: Fluorescence microscope
Filter set: GFP (Ex: 470/40 nm, Em: 525/50 nm)
Plate reader detection
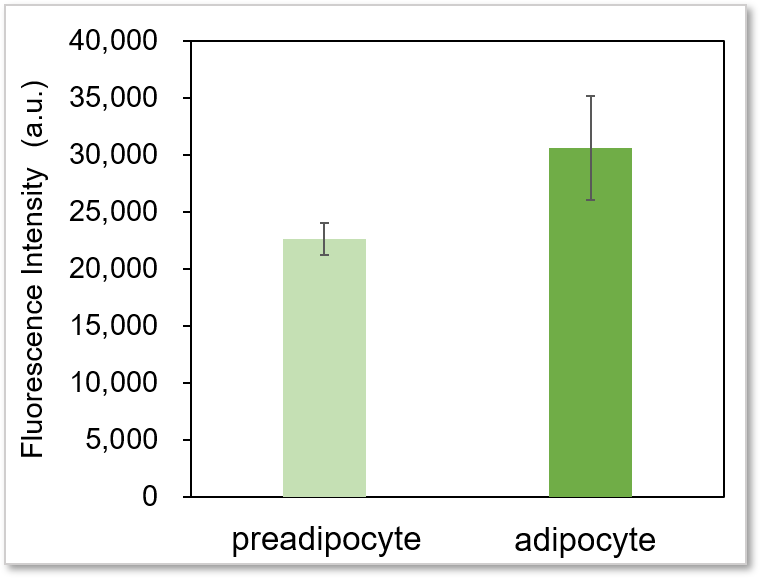
Detection conditions
Ex: 488 nm, Em: 520 nm
* It is difficult to make adipocyte evenly on the wells, so there may be some error in the data.
Experimental procedure
1. Progenitor adipocytes and adipocytes were seeded onto ibi 96-well plates and cultured overnight.
2. The cells were washed twice with glucose-free medium DMEM, and then glucose-free medium was added.
3. The cells were incubated at 37 °C for 15 minutes.
4. Probe solution (500-fold dilution) in glucose-free medium was added, and the cells were incubated at 37 °C for 15 minutes.
5. Wash the cells three times with WI Solution (1x) chilled to 4 °C and add WI Solution (4 °C).
6. The cells were observed using a fluorescence microscope and plate reader.
[Flow cytometry] Example procedure: Co-staining of Glucose uptake probe-Green and markers for immunostaining
1. Wash the cells with PBS x 2
2. Stain zombie yellow
3. Incubate for 30 min at 4°C
4. Wash the cells with RPMI (1% FCS) x 2
5. Stain cell surface antibody
6. Incubate for 30 min at 4°C
7. Wash the cells with RPMI-No glucose x 2
8. Add pre-warmed RPMI (37°C), divide into five
| Sample | GLUP-G | Media | GLUT inhibitor |
| 1 | – | RPMI-No glucose | – |
| 2 | + | RPMI-No glucose | – |
| 3 | + | RPMI with glucose | – |
| 4 | + | RPMI-No glucose | + |
| 5 | + | RPMI-No glucose | + |
9. Incubate for 15 min at 37 °C in a CO2 incubator
10. Centrifuge at 1,500 rpm for 5 min at r.t., remove the supernatant
11. Add pre-warmed Glucose uptake probe-Green (+/- inhibitor) for 15 min at 37 °C in a CO incubator
12. Wash with ice-cooled WI solution x 2
13. FCM analysis
Experimental Examole: Induction of Ferroptosis by Erastin
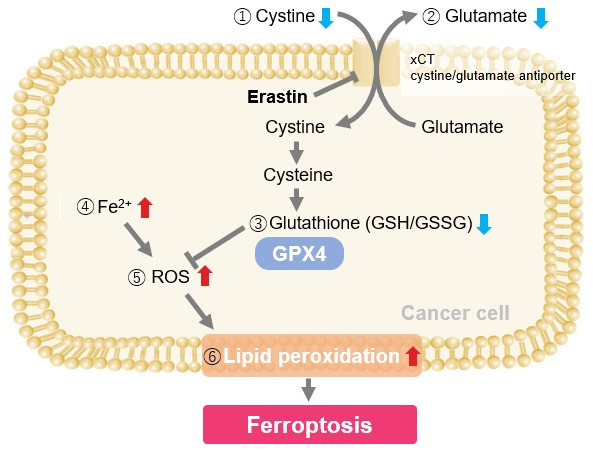
Erastin is a known inducer of ferroptosis. By inhibiting the cystine transporter (xCT), erastin inhibits the uptake of cystine. Cystine is the raw material for GSH. Therefore, Erastin ultimately decreases the amount of GSH. Decreased GSH then results in lipid peroxide accumulation and induction of ferroptosis.
The following experimental examples show changes in each aforementioned index as a consequence of erastin stimulation. Measurements are made using Dojindo reagents.
Using erastin-treated A549 cells, we measured intracellular Fe2+, ROS, lipid peroxide, glutathione, glutamate release into the extracellular space, and cystine uptake. As a result, inhibition of xCT by elastin was observed and also the release of glutamate and uptake of cystine were decreased. Furthermore, elastin treatment decreased intracellular glutathione while it increased intracellular Fe2+ , ROS, and lipid peroxides.

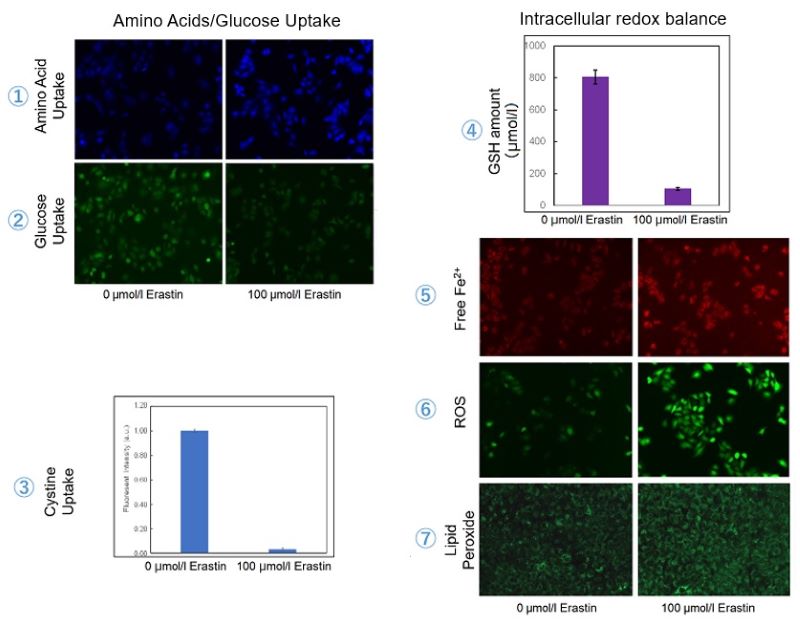
| 1 Amino Acid Uptake | : Amino Acid Uptake Assay Kit (Code: UP04) |
| 2 Glucose Uptake | : Glucose Uptake Assay Kit-Green (Code: UP02) |
| 3 Cystine Uptake | : Cystine Uptake Assay Kit (Code: UP05) |
| 4 Intracellular glutathione | : GSSG/GSH Quantification Kit (Code: G257) |
| 5 Intracellular labile Fe | : FerroOrange (Code: F374) |
| 6 Intracellular total ROS | : ROS Assay Kit -Highly Sensitive DCFH-DA- (Code: R252) |
| 7 Lipid Peroxides | : Liperfluo (Code: L248) |
Cell Line: A549
Incubation Conditions: 100 μmol/l Erastin/MEM, 37℃, 3h